
Render Farm Hardware Benchmark: Cinebench Scores Explained for Cloud Rendering (2026)
Overview
Introduction
TL;DR: Cinebench R23 (CPU, nT) and Cinebench 2024 (GPU) scores are a rough directional guide to render farm speed, not a precise calculator. An RTX 4090 scores about 14,500 points in the Cinebench 2024 GPU test versus roughly 27,000 for our RTX 5090 fleet — about 1.85x per card — but scene complexity, VRAM headroom, and plugin overhead all move real render times independently of the benchmark. A short test render on your actual scene beats extrapolating from a Cinebench score.
Every 3D artist has run Cinebench at least once. You score your RTX 4090 at roughly 14,500 points in the GPU test, or your Ryzen 9 7950X at 36,000 nT in R23, and you walk away with a number. What most artists then ask is: how does that number compare to what a render farm actually runs?
At Super Renders Farm, we maintain a GPU fleet of NVIDIA RTX 5090 cards with 32 GB VRAM each, alongside more than 20,000 CPU cores on dual-socket Intel Xeon nodes. Over the years we've had clients arrive with Cinebench screenshots in hand, trying to estimate their speed gain before committing to a job. The honest answer is that benchmarks tell you something useful — but not everything. This guide explains what Cinebench R23 and Cinebench 2024 scores actually mean for production rendering, how artist workstation hardware compares to cloud farm GPU specs, and where benchmark numbers stop being reliable predictors.
Cinebench 2024 GPU and R23 CPU benchmark scores: RTX 5090 vs RTX 4090 vs workstation CPUs
What Cinebench Actually Measures
Cinebench has two versions in active use: R23 and Cinebench 2024.
Cinebench R23 is a CPU-only benchmark. It renders a standardized Cinema 4D scene using your processor's cores and returns two scores: single-core (ST) and multi-threaded (nT). For production rendering, the nT score is what matters — it reflects how efficiently your CPU threads distribute across a render workload. This is the benchmark most artists quote when comparing workstations.
Cinebench 2024 modernized the test scene and, critically, added a dedicated GPU render test. This GPU test is the relevant benchmark if you work with GPU-accelerated engines like Redshift, Octane, or V-Ray GPU — it actually runs on the graphics card, not the CPU.
A common mistake we see in client conversations: artists use their R23 CPU score to estimate GPU render farm throughput. These measure entirely different hardware. If your pipeline runs Redshift on GPU, the R23 score is largely irrelevant to your frame render time. Use the Cinebench 2024 GPU test for that comparison. Maxon provides Cinebench as a free download from the official page. For a deeper look at how CPU and GPU pipelines differ in practice, our GPU vs CPU rendering guide covers the key architectural differences.
Artist Workstation Reference Scores
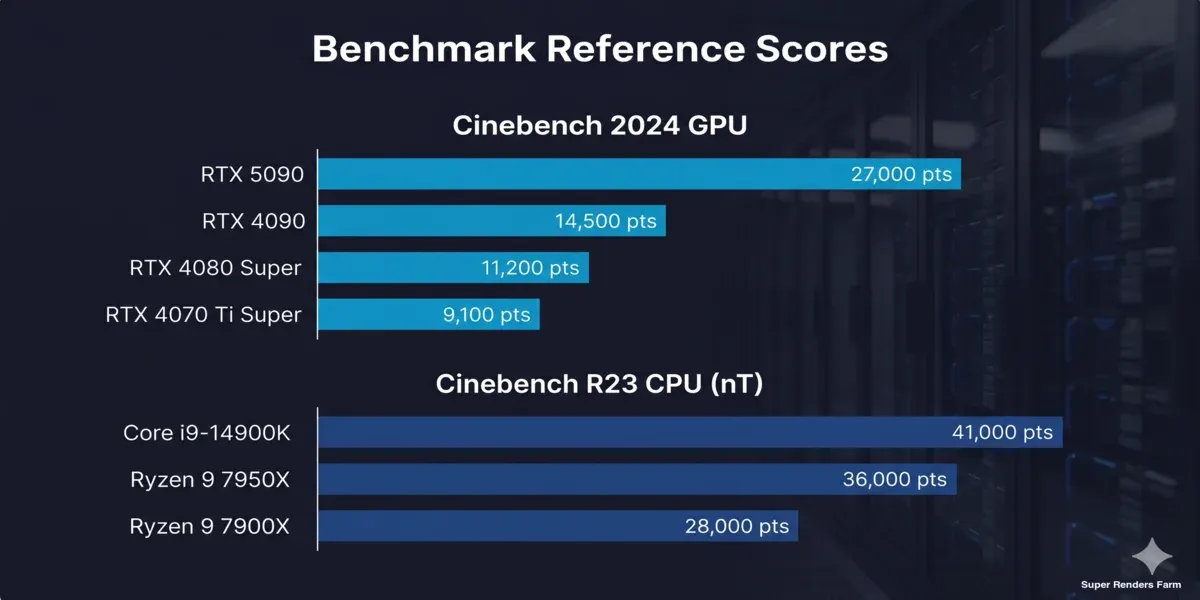
Here's where common high-end workstation hardware lands in benchmark testing:
Cinebench R23 — CPU Multi-Threaded (nT):
| CPU | nT Score (approx.) | Cores / Threads |
|---|---|---|
| Intel Core i9-14900K | ~41,000 pts | 24C / 32T |
| Intel Core i9-13900K | ~38,000 pts | 24C / 32T |
| AMD Ryzen 9 7950X | ~36,000 pts | 16C / 32T |
| AMD Ryzen 9 7900X | ~28,000 pts | 12C / 24T |
| Apple M3 Max (14-core) | ~23,000 pts | 14C |
Mid-range workstations (Ryzen 7 7700X, Core i7-14700K) typically land between 16,000 and 22,000 nT. This range is the baseline most studios work with day-to-day.
Cinebench 2024 — GPU:
| GPU | GPU Score (approx.) | VRAM |
|---|---|---|
| NVIDIA RTX 4090 | ~14,500 pts | 24 GB |
| NVIDIA RTX 4080 Super | ~11,200 pts | 16 GB |
| NVIDIA RTX 4070 Ti Super | ~9,100 pts | 16 GB |
| NVIDIA RTX 3090 Ti | ~7,800 pts | 24 GB |
The RTX 4090 is the practical ceiling for a single-GPU artist workstation. It's the number most studios use as a reference point when evaluating whether cloud hardware would be meaningfully faster.
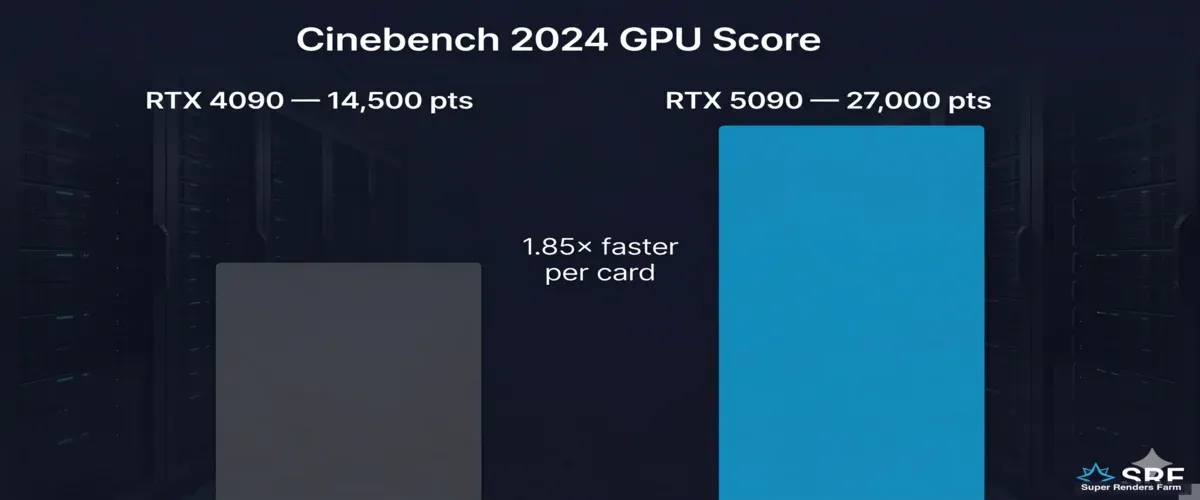
Cinebench 2024 GPU score: RTX 4090 at 14,500 points versus RTX 5090 at 27,000 points — 1.85x faster per card
How Cloud GPU Hardware Compares
Our GPU fleet runs NVIDIA RTX 5090 cards — Blackwell-architecture hardware with 32 GB GDDR7 VRAM per card. In Cinebench 2024 GPU testing, the RTX 5090 scores approximately 27,000 points, roughly 1.85× higher than the RTX 4090's 14,500. We covered the RTX 5090's real-world rendering performance in more detail in our RTX 5090 cloud rendering performance article.
That per-card advantage matters for single-frame GPU renders. But for production animation sequences, the architecture of farm rendering changes the comparison entirely.
Frame-parallel GPU rendering — where each frame dispatches to a separate GPU node — is the dominant mode for animation work on a farm. In this model, throughput scales with the number of active GPU nodes, not per-card benchmark score. If you're running an animation job across 10 GPU machines simultaneously, the effective throughput is 10× the per-node speed, regardless of whether that node runs an RTX 4090 or RTX 5090. The benchmark gap between cards matters most for single-hero-frame stills or scenes that can't be decomposed into independent frames.
For CPU rendering with V-Ray CPU, Corona, or Arnold, our dual Intel Xeon E5-2699 V4 nodes contribute 44 cores per machine across a job. Where a single workstation renders one frame at a time, a farm dispatches multiple frames across multiple machines in parallel — the aggregate core count across active nodes far exceeds what any single workstation provides.
VRAM: The Benchmark Cinebench Doesn't Test
The hardware constraint that most often blocks production renders isn't reflected in any Cinebench score at all — it's VRAM.
At 32 GB VRAM per card, our RTX 5090 nodes handle scenes that would hit the 24 GB ceiling of an RTX 4090 workstation. We regularly see archviz projects with heavy displacement, multi-layer 8K texture sets, and VDB simulations that simply won't load into 24 GB — but render without issues at 32 GB. For character work with complex subdivision and layered shader stacks, the VRAM headroom often determines whether a scene is farm-renderable at all.
Cinebench runs a fixed standardized scene that fits comfortably in any modern GPU's VRAM budget. It doesn't surface this constraint. If you're evaluating a render farm for complex scenes, VRAM per GPU is often a more important question than benchmark score. Our GPU cloud render farm page lists current VRAM specs per card.
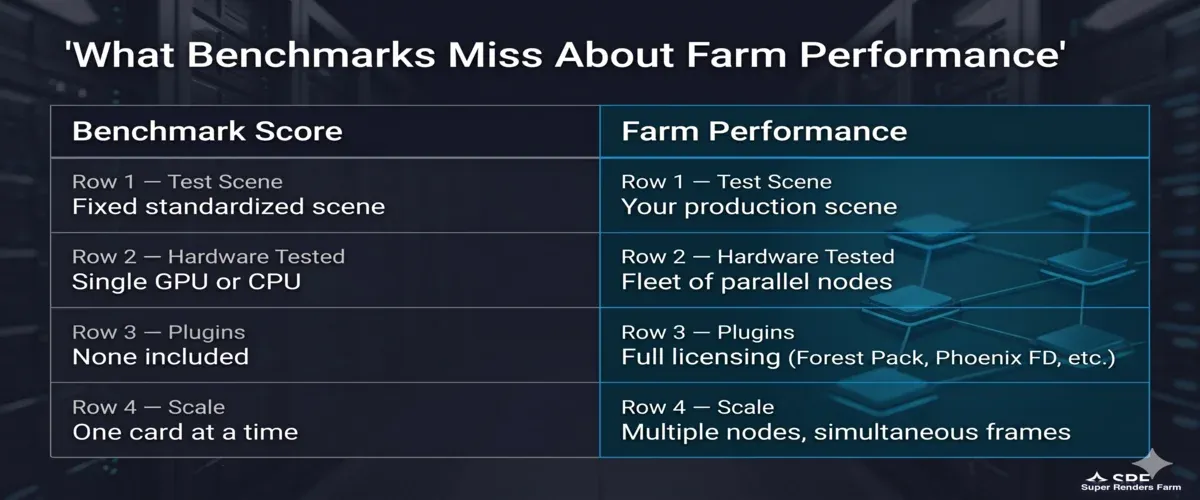
What benchmark scores measure versus what render farm performance actually delivers
What Benchmark Scores Don't Predict
A few production realities that Cinebench can't capture:
Scene complexity delta: The standardized test scene renders predictably. Production scenes with 50M+ polygon environments, nested scatter arrays, or procedural simulations deviate from benchmark extrapolations. We always recommend submitting a test frame at reduced resolution before committing a full job.
Plugin licensing on farm: Forest Pack, RailClone, Phoenix FD, Mograph effectors — all require active licenses on farm worker nodes. A farm without the correct plugin licensing can't render your scene regardless of GPU score. Confirm plugin support before evaluating performance numbers.
Engine-specific multi-GPU behavior: Redshift supports distributed rendering across multiple GPUs within a single frame to some degree. V-Ray GPU's multi-GPU support for single-frame rendering has different architectural constraints. Octane handles GPU parallelism differently again. Benchmark scores don't reflect these engine-specific behaviors.
We use Cinebench R23 internally as a hardware health check — fast to run, catches thermal throttling or hardware degradation between maintenance cycles. For actual render time estimation, we test with a downsampled version of the client's real scene and report actual frame times, not extrapolations from a benchmark score.
For a different lens on the same question, our render-farm GPU benchmarking methodology covers cost-per-frame measurement in more depth, our V-Ray Benchmark guide does the same for V-Ray's own vsamples/vpaths scores, and our multi-GPU scaling results show what a second card actually buys you.
For pricing based on your specific engine, check the pricing page for current per-GHz-hour CPU rates and GPU instance costs.
FAQ
Q: What is a good Cinebench R23 score for 3D rendering? A: For multi-threaded CPU rendering, a score above 30,000 nT handles most production workflows at reasonable speeds. High-end workstations with a Ryzen 9 7950X or Core i9-14900K score between 36,000 and 42,000 nT. Keep in mind that R23 is a CPU-only test — if you render with Redshift or Octane, use the Cinebench 2024 GPU benchmark instead, as those engines run on the graphics card, not the CPU.
Q: How does an RTX 4090 Cinebench score compare to cloud GPU performance? A: The RTX 4090 scores approximately 14,500 points in the Cinebench 2024 GPU test. Our current GPU fleet runs NVIDIA RTX 5090 cards, which benchmark around 27,000 points — roughly 1.85× higher per card. For animation sequences, the advantage compounds further because multiple GPU nodes render different frames simultaneously, multiplying total throughput far beyond the per-card benchmark difference.
Q: Does Cinebench R23 predict GPU render farm performance? A: Not directly. Cinebench R23 is a CPU rendering test and doesn't run on the GPU at all. If your pipeline uses GPU-based engines like Redshift or V-Ray GPU, use the Cinebench 2024 GPU benchmark as the reference point. For CPU engines like V-Ray CPU or Corona, the R23 multi-threaded score is a useful proxy, though actual render times also depend on scene complexity, plugin availability, and how the farm distributes frames across nodes.
Q: How much VRAM do render farm GPU nodes typically have? A: Our GPU nodes run NVIDIA RTX 5090 cards with 32 GB VRAM each. This matters for production scenes that exceed the 24 GB limit of RTX 4090 workstations — high-poly archviz environments, large VDB simulations, and complex character rigs with heavy displacement can all require VRAM headroom beyond what a single local GPU provides. Cinebench uses a standardized test scene that fits in most modern VRAM budgets, so it won't surface this constraint for your specific scene.
Q: What is the difference between Cinebench R23 and Cinebench 2024? A: Cinebench R23 tests CPU rendering only — it runs Cinema 4D's CPU renderer on a standardized scene and reports single-core and multi-core scores. Cinebench 2024 updates the test scene and adds a separate GPU render test, making it more relevant for artists using GPU-accelerated engines. Both versions are available as free downloads from Maxon's Cinebench page. For most production benchmarking, use the Cinebench 2024 GPU test if you're on a GPU pipeline, or R23 nT if you're on CPU.
Q: Can I use my Cinebench score to estimate render farm costs? A: It's a rough directional indicator, not a precise calculator. The benchmark runs a fixed scene — your production scene with complex geometry, 8K textures, and plugin dependencies will behave differently. Most render farms, including ours, offer test render options where you can submit a few frames at reduced resolution to get actual timing data before committing a full job. Real-scene timing is more reliable than extrapolating from a benchmark score.
About Thierry Marc
3D Rendering Expert with over 10 years of experience in the industry. Specialized in Maya, Arnold, and high-end technical workflows for film and advertising.


